
Using the API Explorer
The API Explorer is your first line of defense when debugging. It allows you to:- Learn how to call the API - See exact request formats
- See what the response looks like - Verify data structure before coding
- Access framework-specific guides - Direct links to implementation tutorials
Accessing the API Explorer
Navigate to any content in your dashboard and look for the API Explorer button: For Blog Posts: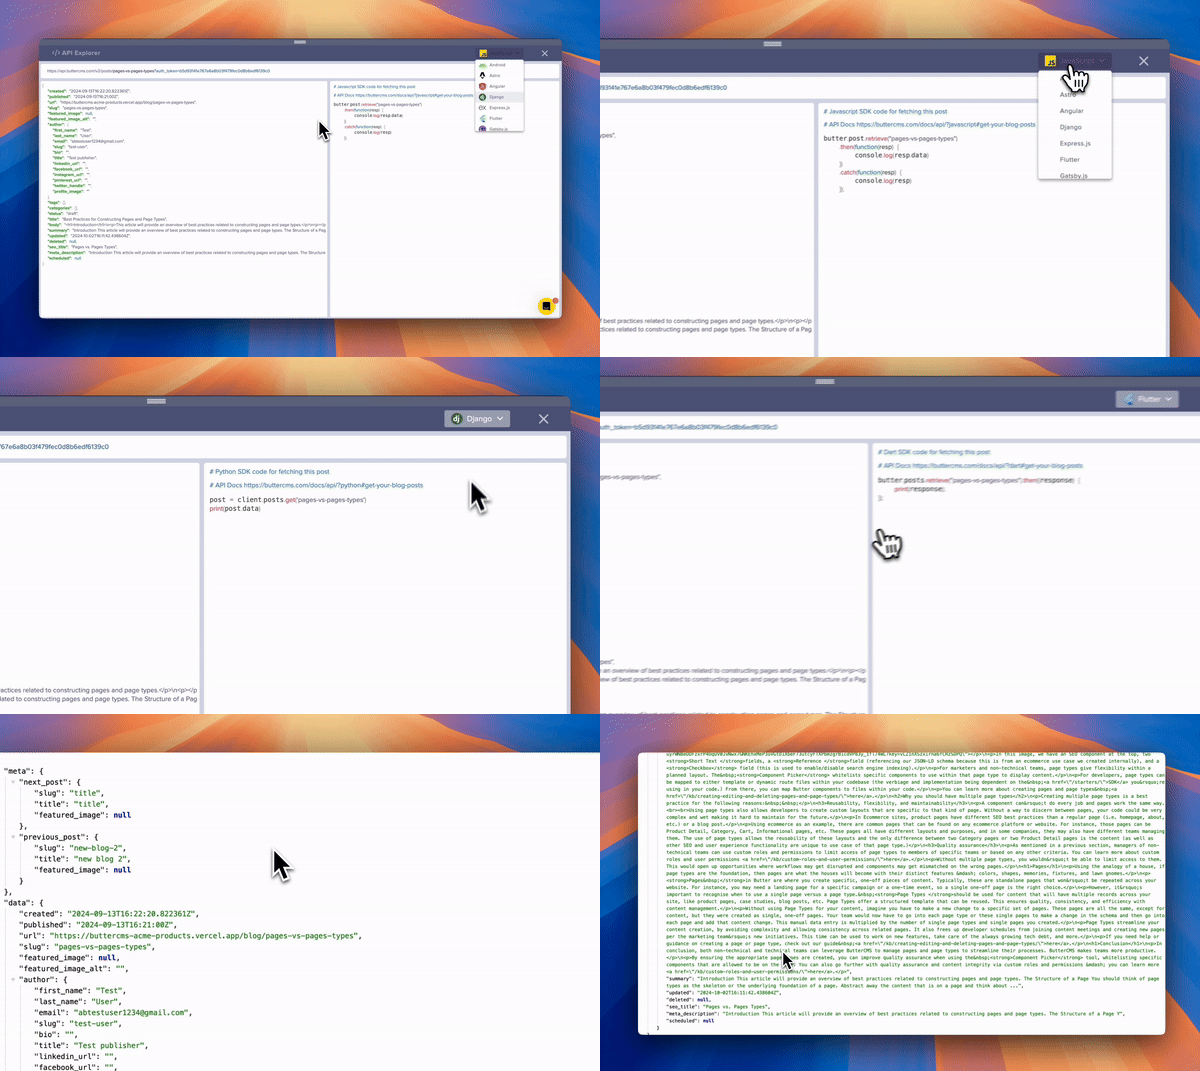 For Pages:
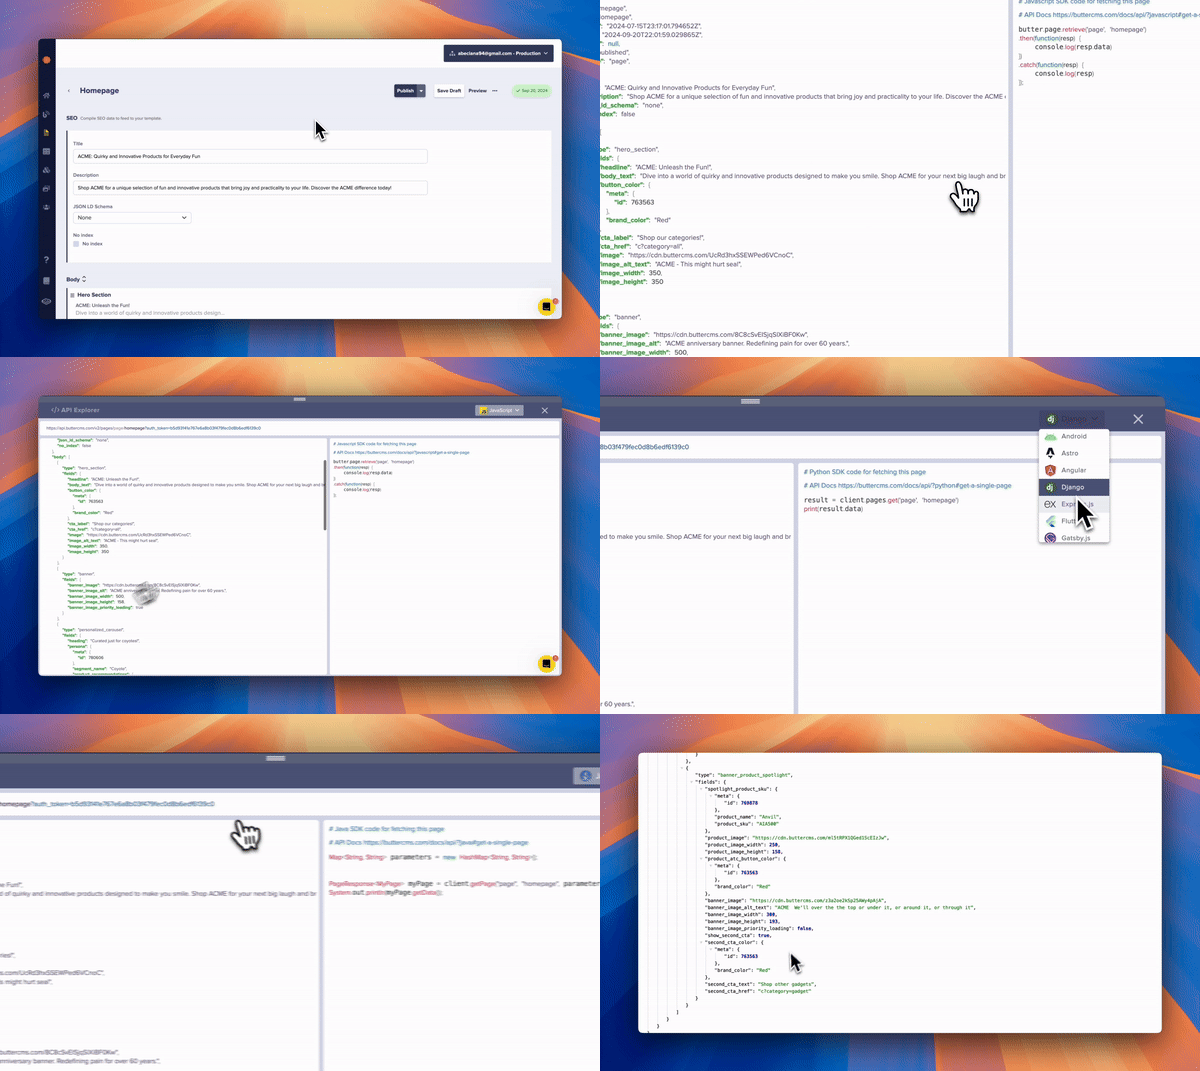 For Collections:
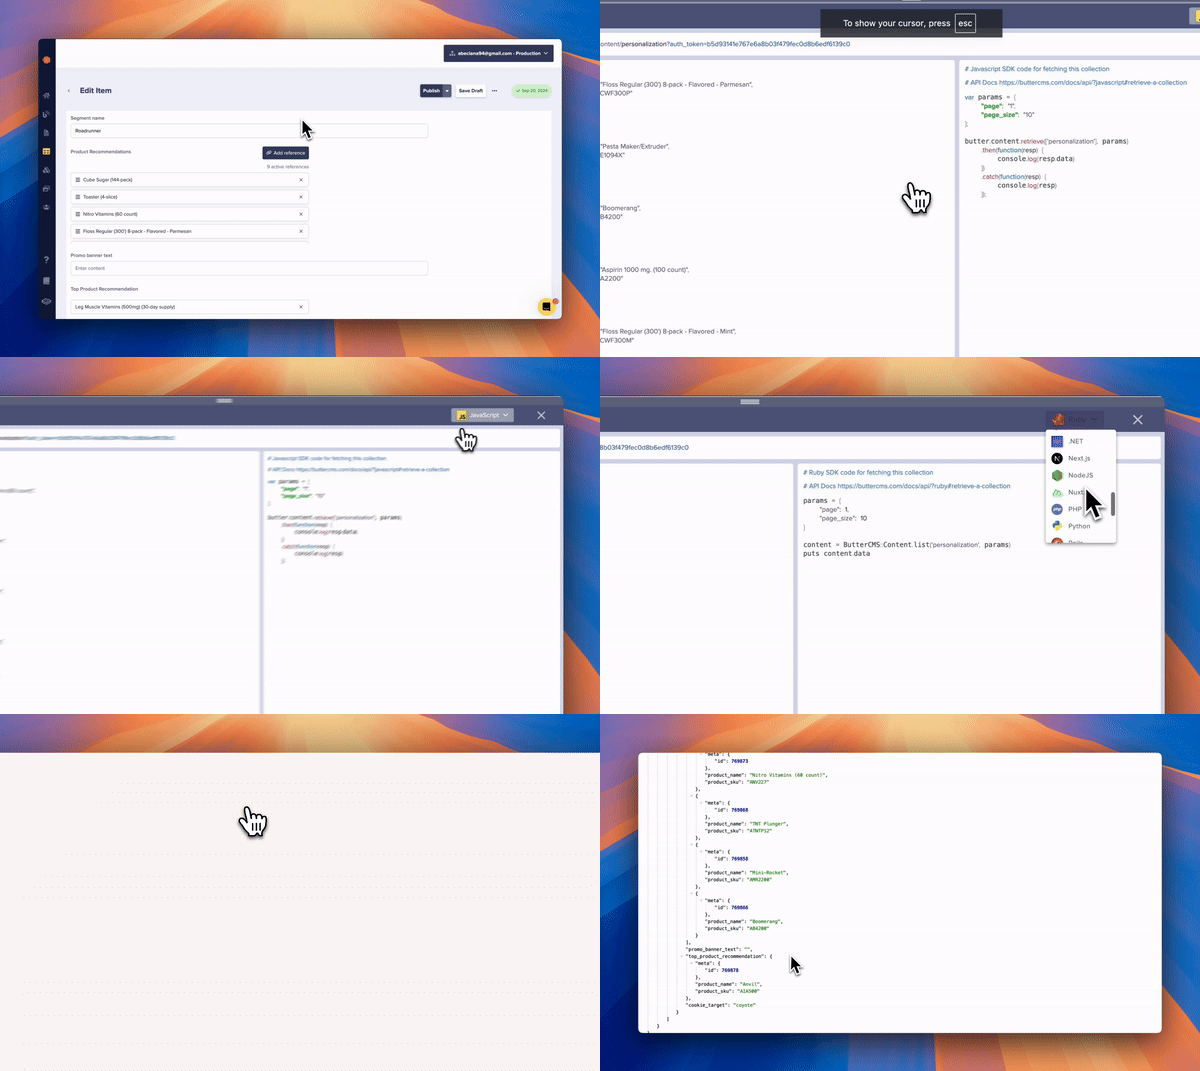
Step-by-step debugging process
Step 1: verify your API token
Before diving into complex debugging, confirm your authentication is working:{"detail": "Authentication credentials were not provided"}
Step 2: check the network tab
Open your browser’s Developer Tools (F12) and navigate to the Network tab:- Filter by “XHR” or “Fetch” requests
- Look for requests to
api.buttercms.com - Check the Status column for error codes
- Click on failed requests to see:
- Headers: Verify Authorization header is present
- Response: Read the error message
- Payload: Confirm request body is correct (for write operations)
Step 3: add debug logging
Add strategic console logs to trace data flow:Step 4: validate API response structure
Compare your expected data structure with the actual API response:Common debugging scenarios
Scenario 1: content returns empty
Symptoms: API call succeeds (200 OK) but data array is empty. Debug Checklist:1. Check content is published
1. Check content is published
Go to your ButterCMS dashboard and verify the content status is “Published”, not “Draft”.
2. Verify the page type key
2. Verify the page type key
3. Check locale parameter
3. Check locale parameter
If using localization, ensure the locale parameter matches:
4. Verify API token has access
4. Verify API token has access
Some tokens may have restricted access. Try with a new token from Settings.
Scenario 2: unexpected data structure
Symptoms: Code breaks because expected fields are missing or structured differently. Debug Steps:- Use the API Explorer to see the actual structure
- Log the full response before accessing nested properties
- Check for optional fields that might not always be present
Scenario 3: cached content issues
Symptoms: Updates made in dashboard don’t appear in your application. Debug Steps:- Clear browser cache: Hard refresh with Ctrl+Shift+R
- Check CDN cache: CDN cache is automatically invalidated when you publish. If changes don’t appear immediately, wait up to 60 seconds for global propagation
- Verify local caching: If using application-level caching, clear it
- Use cache-busting: Add timestamp to API calls for testing
Scenario 4: webhook not triggering code
Symptoms: Webhook is configured but your endpoint isn’t receiving calls. Debug Steps:-
Test endpoint accessibility:
-
Use a webhook testing service:
- Go to a url testing site, like webhook.site
- Copy the unique URL
- Temporarily set it as your webhook URL in ButterCMS
- Publish content and verify the request arrives
- After verifying webhooks are received (typically 1-2 test publishes), restore your production webhook URL
-
Check webhook logs in your server:
Framework-specific debugging
React/Next.js
Python/Django
Debugging tools checklist
Use this checklist when debugging any ButterCMS integration issue.
When to contact support
If you’ve tried the above steps and still can’t resolve the issue, contact support with:- Your account email
- The specific endpoint/content causing issues
- Error messages (full text, not screenshots)
- Steps to reproduce the issue
- What you’ve already tried
Contact Support
Reach our support team
API Error Codes
Reference all error codes